Matthew Beckler's Home Page
:: :: :: :: :: ::
Java Heat Map
Convert Cadence Layout to SVG / PDF / PNG
Makefile -jX setting: How many concurent jobs is optimal?
Infinite Grid of Resistors
How to Start and Stop Folding@Home on OSX
Lego Rendering with POV-Ray
Class Scheduler
Lightsaber Rotoscoping Scripts

Handy Scripts
GPG Tips and Tricks
NCAA Basketball Tournament Data

Isometric Projection in Inkscape
Perspective Motivational Poster
SVG Drawings
SVG Circuit Symbols
Mysterious Textures
LED Bargraph
Abstract: I wanted to be able to visualize an analog signal using LED bargraph displays. In this project I explore capturing and smoothing an analog input signal, pseudo-multiplexing of output, and using a transistor as a switch to switch more current than the microcontroller can handle.
General Description: The device I am using for this project, the PIC18F452, has an integrated Analog to Digital (ADC) converter. This allows the microcontroller to measure an analog signal between 0 and 5 volts, and convert it to a 10-bit binary number. I am using a variable resistor, also known as a potentiometer, to easily create an analog voltage at pin 1 (AN0). In my program, I measure this value 128 times in a row, and then calculate the average of these 128 samples. The average voltage is scaled to be an integer between -10 and 10, inclusive on both ends. An appropriate number of LED segments are lit to represent the value.
More Details (Multiplexed LED's): Using the schematics below, you'll notice that I've connected both LED bargraphs to the same resistors, and therefore the same output pins from the microcontroller. Normally, this would cause both sides to light when a signal is sent out from the chip. However, I have connected each half to a different transistor to act as a "selection" switch. The two transistors are also connected to (and controlled by) the microcontroller, which allows the microcontroller to pick which half of the bargraph to light up. If we were to simply hook up all 20 LED's to the chip, it would require 20 output pins. If we use a method like this, we can get away with only 12 pins, saving 8 pins for other uses. This trick relies on the fact that only one of the bargraphs will ever be lit at the same time. It also simplifies our code somewhat, as we can use the same output pin settings for, say, both +5 and -5. The magnitude is the only thing that determines the output pin settings for the LED's. The sign is used to determine which transistor is activated, and therefore which LED bargraph is activated.
Each LED is wired-up with the anode (positive side) connected through the transistor. The cathode (negative side) is connected through to the microcontroller through a current-limiting resistor. When we decide to light up an LED, we must do two things: activate the appropriate transistor with a logic high (+5 volts) signal, and set our output pin to logic low (0 volts / ground). This allows current to flow from the +5 volt source, through the activated transistor, through the LED, through the current-limiting resistor, and through our microcontroller's pin, right to ground.
More Details (Averaging the ADC value): Averaging the analog input signal is a very good idea, as analog signals often times have noise in their signal, which can be somewhat eliminated by taking many samples, and averaging over time. In this project, I take 128 samples as fast as I can, and then average them. If you know something about doing math with binary numbers on computers, you might be wondering how to easily take the average of a series of numbers, and how you can easily re-scale a number to be within a specific range. Using floating-point numbers would be a nightmare, as they require very complicated algorithms, especially on a RISC device such as this. I use fixed-point numbers for this project, and it works very nicely.
The output from the ADC is a 10-bit number, that is available in C through the variable ADRES (Analog-to-Digital RESult). The maximum 10-bit value is 2^10 - 1 = 1023. This means that all the possible results from one ADC conversion will be between 0 and 1023. In my sampling loop, I simply add up all 128 samples. After those 128 cycles, our sum will be a number between 0 and 130944. These two values correspond to an input voltage that was always 0, and and an input voltage that was always the maximum. The maximum voltage will be converted to the number 1023, and if we are taking 128 samples, our maximum sum will be 128*1023 = 130944. If we divide the sum by 130944, we would normally get a value between 0 and 1, but since we are working with integer values, we actually get a value of either 0 or 1. If we desire a value between -10 and +10, we must scale the number by a factor of 20. It's tempting to simply try multiplying the scaled value by 20, but with our value already reduced down to either 0 or 1, we must try something different.
To correctly scale the number by a factor of 20, we must first look at how the computer performs division. Since we are using integer values instead of floating-point values, we know that the microcontroller will be doing "integer divison", where the remainder is simply dropped. This brings up an important consideration, that is, we must do our multiplication before our division, otherwise we will loose precision in the division. You'll notice in the source code further down the page that we first multiply the sum by 20, and then divide by our scale factor. This produces a number between 0 and 20. To get our number between -10 and +10, we simply subtract 10 from this temporary average.
Circuit Schematics: Most PIC microcontroller projects have a very general setup involving the crystal oscillator, the pull-up resistor on the MCLR pin, and the 4 power supply connections. For this project, I expanded on the basic setup to include the aforementioned potentiometer connected to pin 1 and a pair of LED bargraphs and their two transistors to PORTC and half of PORTD.
Image 1: The first image is the general setup of the PIC, with off-image connections to the LED bargraphs and transistors:
I made this drawing in Inkscape (download), which is a really cool program. You can download my source drawing file here.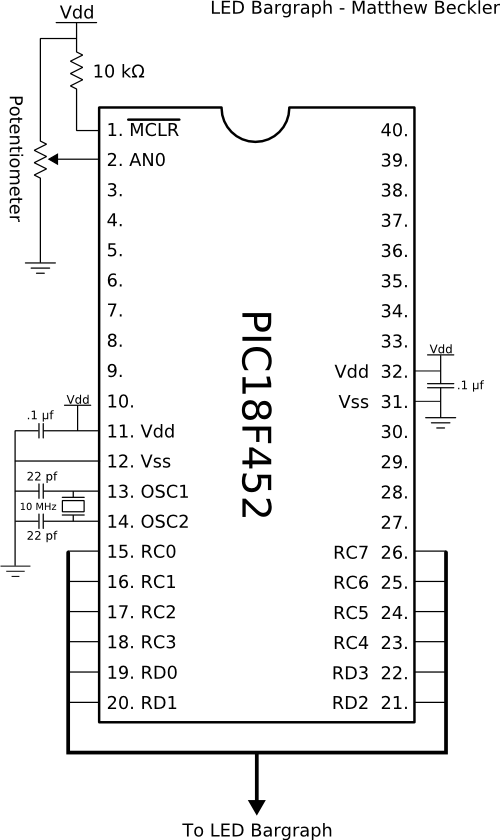
Image 2: The second image details the connections from PORTC and PORTD to the LED bargraphs and transistors. You can see here how both bargraphs are connected to the same resistors, but different transistors. As noted above, the transistors are independently activated to select either the positive or negative bargraph. In this image, I have lit up a few of the segments to show what it would look like when displaying the value +6.
I made this drawing in Inkscape (download), which is a really cool program. You can download my source drawing file here.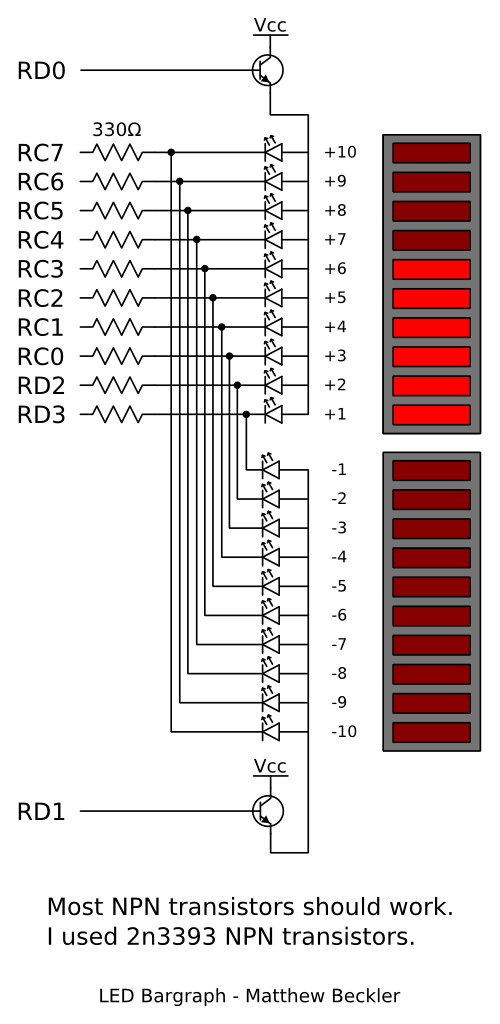
Note: As noted in the second image, most any NPN BJT will work. I used 2N3393 NPN transistors, as that's what I had on hand.
Results: This project turned out quite nice, and performed as I had expected. When I turn the potentiometer to the right, the right-most LED bargraph lights up in proportion to how far I have turned it. The same happens as I turn to the left, but with the left-most bargraph. To see a very short video I've taken of the LED bargraph in operation, click the image below. Please note that I only had one actual LED bargraph module, so I had to substitute discrete LED's for the negative bargraph.
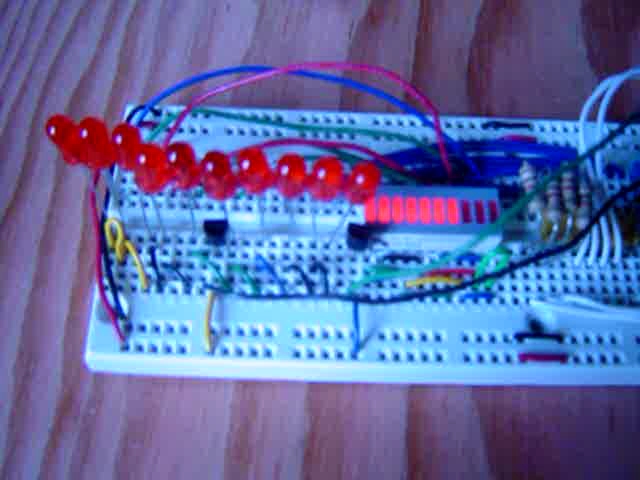
Click to watch demo video (MPG, 3.7 MB)
Pseudo-Code: To aid in understanding of my source code, I like to write up some general pseudo-code:
setup PORTC, PORTD, and the ADC

do forever:

    do 128 times:

        Read ADC value

    scale average voltage to be between -10 and +10, inclusive

    based on the sign of the average, activate the appropriate transistor

    activate the apropriate LED segments depending on the magnitude of the average
Source Code: Download Source Code
#include <p18f452.h>

#pragma config OSC=HSPLL, WDT=OFF, BOR=OFF, PWRT=ON


//This function delays for 14 us (micro-seconds)

//Assumes a 10 MHz crystal in HSPLL mode

//Overall, Fosc = 40 MHz

void delay(void)

{

  int x = 3;

  while (x--);

}


void main(void)

{

  //long int = 4 bytes = 32 bits

  unsigned long int i, d0, d1;

  signed long int average;

  unsigned long int values;

  unsigned long int scaleFactor = 130944;

  //130944 = 1023 (max ADC value) * 128 (number of samples)


  //initialize the ADC registers:

  ADCON0 = 0b10000001;

  ADCON1 = 0b11000000;


  //initialize PORTC and PORTD:

  PORTC = 0;

  TRISC = 0;


  PORTD = 0;

  TRISD = 0;


  while(1)

  {

    values = 0;

    average = 0;


    for (i = 0; i < 128; i++)


    {

      delay(); //wait 14 us for acquisition

      ADCON0bits.GO = 1; //start AD conversion

      while (ADCON0bits.GO); //wait for AD to finish

      values += ADRES;

    }


    //calculate bargraph values:

    average = (values * 20) / (scaleFactor);

    average -= 10;


    if (average < 0)


    {

      PORTDbits.RD0 = 0; // turn off positive


      PORTDbits.RD1 = 1; // turn on negative

    }

    else if (average > 0)

    {


      PORTDbits.RD0 = 1; // turn on positive

      PORTDbits.RD1 = 0; // turn off negative

    }

    else

    {

      PORTDbits.RD0 = 0; // turn off positive

      PORTDbits.RD1 = 0; // turn off negative

    }


    PORTDbits.RD2 = 0;

    PORTDbits.RD3 = 0;

    switch (average)

    {

      case -10:

      case +10:

        PORTC = 0b00000000;

        break;

      case -9:

      case +9:

        PORTC = 0b10000000;

        break;

      case -8:

      case +8:

        PORTC = 0b11000000;

        break;

      case -7:

      case +7:

        PORTC = 0b11100000;

        break;

      case -6:

      case +6:

        PORTC = 0b11110000;

        break;

      case -5:

      case +5:

        PORTC = 0b11111000;

        break;

      case -4:

      case +4:

        PORTC = 0b11111100;

        break;

      case -3:

      case +3:

        PORTC = 0b11111110;

        break;

      case -2:

      case +2:

        PORTC = 0b11111111;

        //RD2 = RD3 = 0;

        break;

      case -1:

      case +1:

        PORTC = 0b11111111;

        PORTDbits.RD2 = 1;

        //PORTDbits.RD3 = 0;

        break;

      case 0:

      default:

        PORTC = 0b11111111;

        PORTDbits.RD2 = 1;

        PORTDbits.RD3 = 1;

        break;

    }

  }

}


Copyright © 2004 - 2024, Matthew L. Beckler, CC BY-SA 3.0
Last modified: 2009-10-23 06:06:55 PM (EDT)